Sunspot
Sunspots are temporary phenomena on the photosphere of the Sun that appear visibly as dark spots compared to surrounding regions. They are caused by intense magnetic activity, which inhibits convection by an effect comparable to the eddy current brake, forming areas of reduced surface temperature. Like magnets, they also have two poles. Although they are at temperatures of roughly 3,000–4,500 K (2,730–4,230 °C), the contrast with the surrounding material at about 5780 K (5500 °C) leaves them clearly visible as dark spots, as the luminous intensity of a heated black body (closely approximated by the photosphere) is a function of temperature to the fourth power. If the sunspot were isolated from the surrounding photosphere it would be brighter than an electric arc. Sunspots expand and contract as they move across the surface of the Sun and can be as large as 80,000 kilometers (50,000 mi) in diameter, making the larger ones visible from Earth without the aid of a telescope.[1] They may also travel at relative speeds ("proper motions") of a few hundred m/s when they first emerge onto the solar photosphere.
Manifesting intense magnetic activity, sunspots host secondary phenomena such as coronal loops (prominences) and reconnection events. Most solar flares and coronal mass ejections originate in magnetically active regions around visible sunspot groupings. Similar phenomena indirectly observed on stars are commonly called starspots and both light and dark spots have been measured.[2]
Contents
History
Prehistoric evidence
Studies of stratigraphic data have suggested that the solar cycles have been active for hundreds of millions of years, if not longer; measuring varves in precambrian sedimentary rock has revealed repeating peaks in layer thickness, with a pattern repeating approximately every eleven years. It is possible that the early atmosphere on Earth was more sensitive to changes in solar radiation than today, so that greater glacial melting (and thicker sediment deposits) could have occurred during years with greater sunspot activity.[3] [4] This would presume annual layering; however, alternate explanations (diurnal) have also been proposed. [5]
Analysis of tree rings has revealed a detailed picture of past solar cycles: Dendrochronologically dated radiocarbon concentrations have allowed for a reconstruction of sunspot activity dating back 11,400 years, far beyond the four centuries of available, reliable records from direct solar observation.[6]
Early observations
The earliest surviving record of sunspot observation dates from 364 BC, based on comments by Chinese astronomer Gan De in a star catalogue.[7] By 28 BC, Chinese astronomers were regularly recording sunspot observations in official imperial records.[8]
The first clear mention of a sunspot in Western literature, around 300 BC, was by the ancient Greek scholar Theophrastus, student of Plato and Aristotle and successor to the latter.[9] A more recent sunspot observation was made on 17 March 807 AD by the Benedictine monk Adelmus, who observed a large sunspot that was visible for eight days; however, Adelmus incorrectly concluded he was observing a transit of Mercury.[10] A large sunspot was also seen at the time of Charlemagne's death in 813 AD.[citation needed] Sunspot activity in 1129 was described by John of Worcester, and Averroes provided a description of sunspots later in the 12th century;[11] however, these observations were also misinterpreted as planetary transits, until Galileo gave the correct explanation in 1612.[citation needed]
17th and 18th centuries
Sunspots were first observed telescopically in late 1610 by the English astronomer Thomas Harriot and Frisian astronomers Johannes and David Fabricius, who published a description in June 1611. At the latter time, Galileo had been showing sunspots to astronomers in Rome, and Christoph Scheiner had probably been observing the spots for two or three months using an improved helioscope of his own design. The ensuing priority dispute between Galileo and Scheiner, neither of whom knew of the Fabricius' work, was thus as pointless as it was bitter.
Sunspots had some importance in the debate over the nature of the Solar System. They showed that the Sun rotated, and their comings and goings showed that the Sun changed, contrary to Aristotle (who taught that all celestial bodies were perfect, unchanging spheres).
Rudolf Wolf studied the historical record in an attempt to establish a database on past cyclic variations. His database extended only to 1700, although the technology and techniques for careful solar observations were first available in 1610. Gustav Spörer later suggested a 70-year period before 1716 in which sunspots were rarely observed as the reason for Wolf's inability to extend the cycles into the 17th century.
Sunspots were rarely recorded during the second part of 17th century. Later analysis revealed the problem not to be a lack of observational data but included references to negative observations. Building upon Spörer's earlier work, Edward Maunder suggested that the Sun had changed from a period in which sunspots all but disappeared from the solar surface to a renewal of sunspot cycles starting in about 1700. Adding to this understanding of the absence of solar cycles were observations of aurorae, which were absent at the same time. Even the lack of a solar corona during solar eclipses was noted prior to 1715. The period of low sunspot activity from 1645 to 1717 is known as the Maunder Minimum.
19th century
The cyclic variation of the number of sunspots was first observed by Heinrich Schwabe between 1826 and 1843 and led Wolf to make systematic observations starting in 1848. The Wolf number is a measure of individual spots and spot groupings, which correlates to a number of solar observables. Also in 1848, Joseph Henry projected an image of the Sun onto a screen and determined that sunspots were cooler than the surrounding surface.[12]
After the resumption of sunspot activity, Heinrich Schwabe in 1844 in Astronomische Nachrichten (Astronomical News) reported a periodic change in the number of sunspots.
The Sun emitted an extremely powerful flare on its visible hemisphere on 1 September 1859, leading to what is known as the Carrington Event. It interrupted electrical telegraph service and caused visible aurorae as far south as Havana, Hawaii, and Rome with similar activity in the southern hemisphere.
20th century
The American solar astronomer George Ellery Hale, as an undergraduate at MIT, invented the spectroheliograph, with which he made the discovery of solar vortices. In 1908, Hale used a modified spectroheliograph to show that the spectra of hydrogen exibited the Zeeman effect whenever the area of view passed over a sunspot on the solar disc. This was the first indication that sunspots were basically magnetic phenomena, which appeared in pairs that corresponded with two magnetic poles of opposite polarity.[13] Subsequent work by Hale demonstrated a strong tendency for east-west alignment of magnetic polarities in sunspots, with mirror symmetry across the solar equator; and that the magnetic polarity for sunspots in each hemisphere switched orientation, from one sunspot cycle to the next.[14] This systematic property of sunspot magnetic fields is now commonly referred to as the "Hale-Nicholson law,"[15] or in many cases simply "Hale's law."
21st century
The most powerful flare observed by satellite instrumentation began on 4 November 2003 at 19:29 UTC, and saturated instruments for 11 minutes. Region 486 has been estimated to have produced an X-ray flux of X28. Holographic and visual observations indicate significant activity continued on the far side of the Sun.
Measurements made in the latter part of the 2000s and based also on observation of infrared spectral lines, have suggested that sunspot activity may again be disappearing, possibly leading to a new minimum.[16] From 2007-2009, sunspot levels were far below average. In 2008, the Sun was spot-free 73 per cent of the time, extreme even for a solar minimum. Only 1913 was more pronounced, with 85 per cent of that year clear. The Sun continued to languish through mid-December 2009, when the largest group of sunspots to emerge for several years appeared. Even then, sunspot levels remained well below normal.[17]
In 2006, NASA made a prediction for the next sunspot maximum, being between 150 and 200 around the year 2011 (30-50% stronger than cycle 23), followed by a weak maximum at around 2022.[18][19] The prediction did not come true. Instead, the sunspot cycle in 2010 was still at its minimum, where it should have been near its maximum, which shows the Sun's current unusual low activity.[20]
Due to a missing jet stream, fading spots, and slower activity near the poles, independent scientists of the National Solar Observatory (NSO) and the Air Force Research Laboratory (AFRL) now (2011) predict that the next 11-year solar sunspot cycle, Cycle 25, will be greatly reduced or may not happen at all.[21]
Cycle 24 is now well underway (as of March 2012); measurements indicate that the minimum occurred around December 2008 and that the next maximum will reach a sunspot number of 90 around May 2013.[22] Nothing is yet stated for cycle 25.
Physics
Although the details of sunspot generation are still a matter of research, it appears that sunspots are the visible counterparts of magnetic flux tubes in the Sun's convective zone that get "wound up" by differential rotation. If the stress on the tubes reaches a certain limit, they curl up like a rubber band and puncture the Sun's surface. Convection is inhibited at the puncture points; the energy flux from the Sun's interior decreases; and with it surface temperature.
The Wilson effect tells us that sunspots are actually depressions on the Sun's surface. Observations using the Zeeman effect show that prototypical sunspots come in pairs with opposite magnetic polarity. From cycle to cycle, the polarities of leading and trailing (with respect to the solar rotation) sunspots change from north/south to south/north and back. Sunspots usually appear in groups.
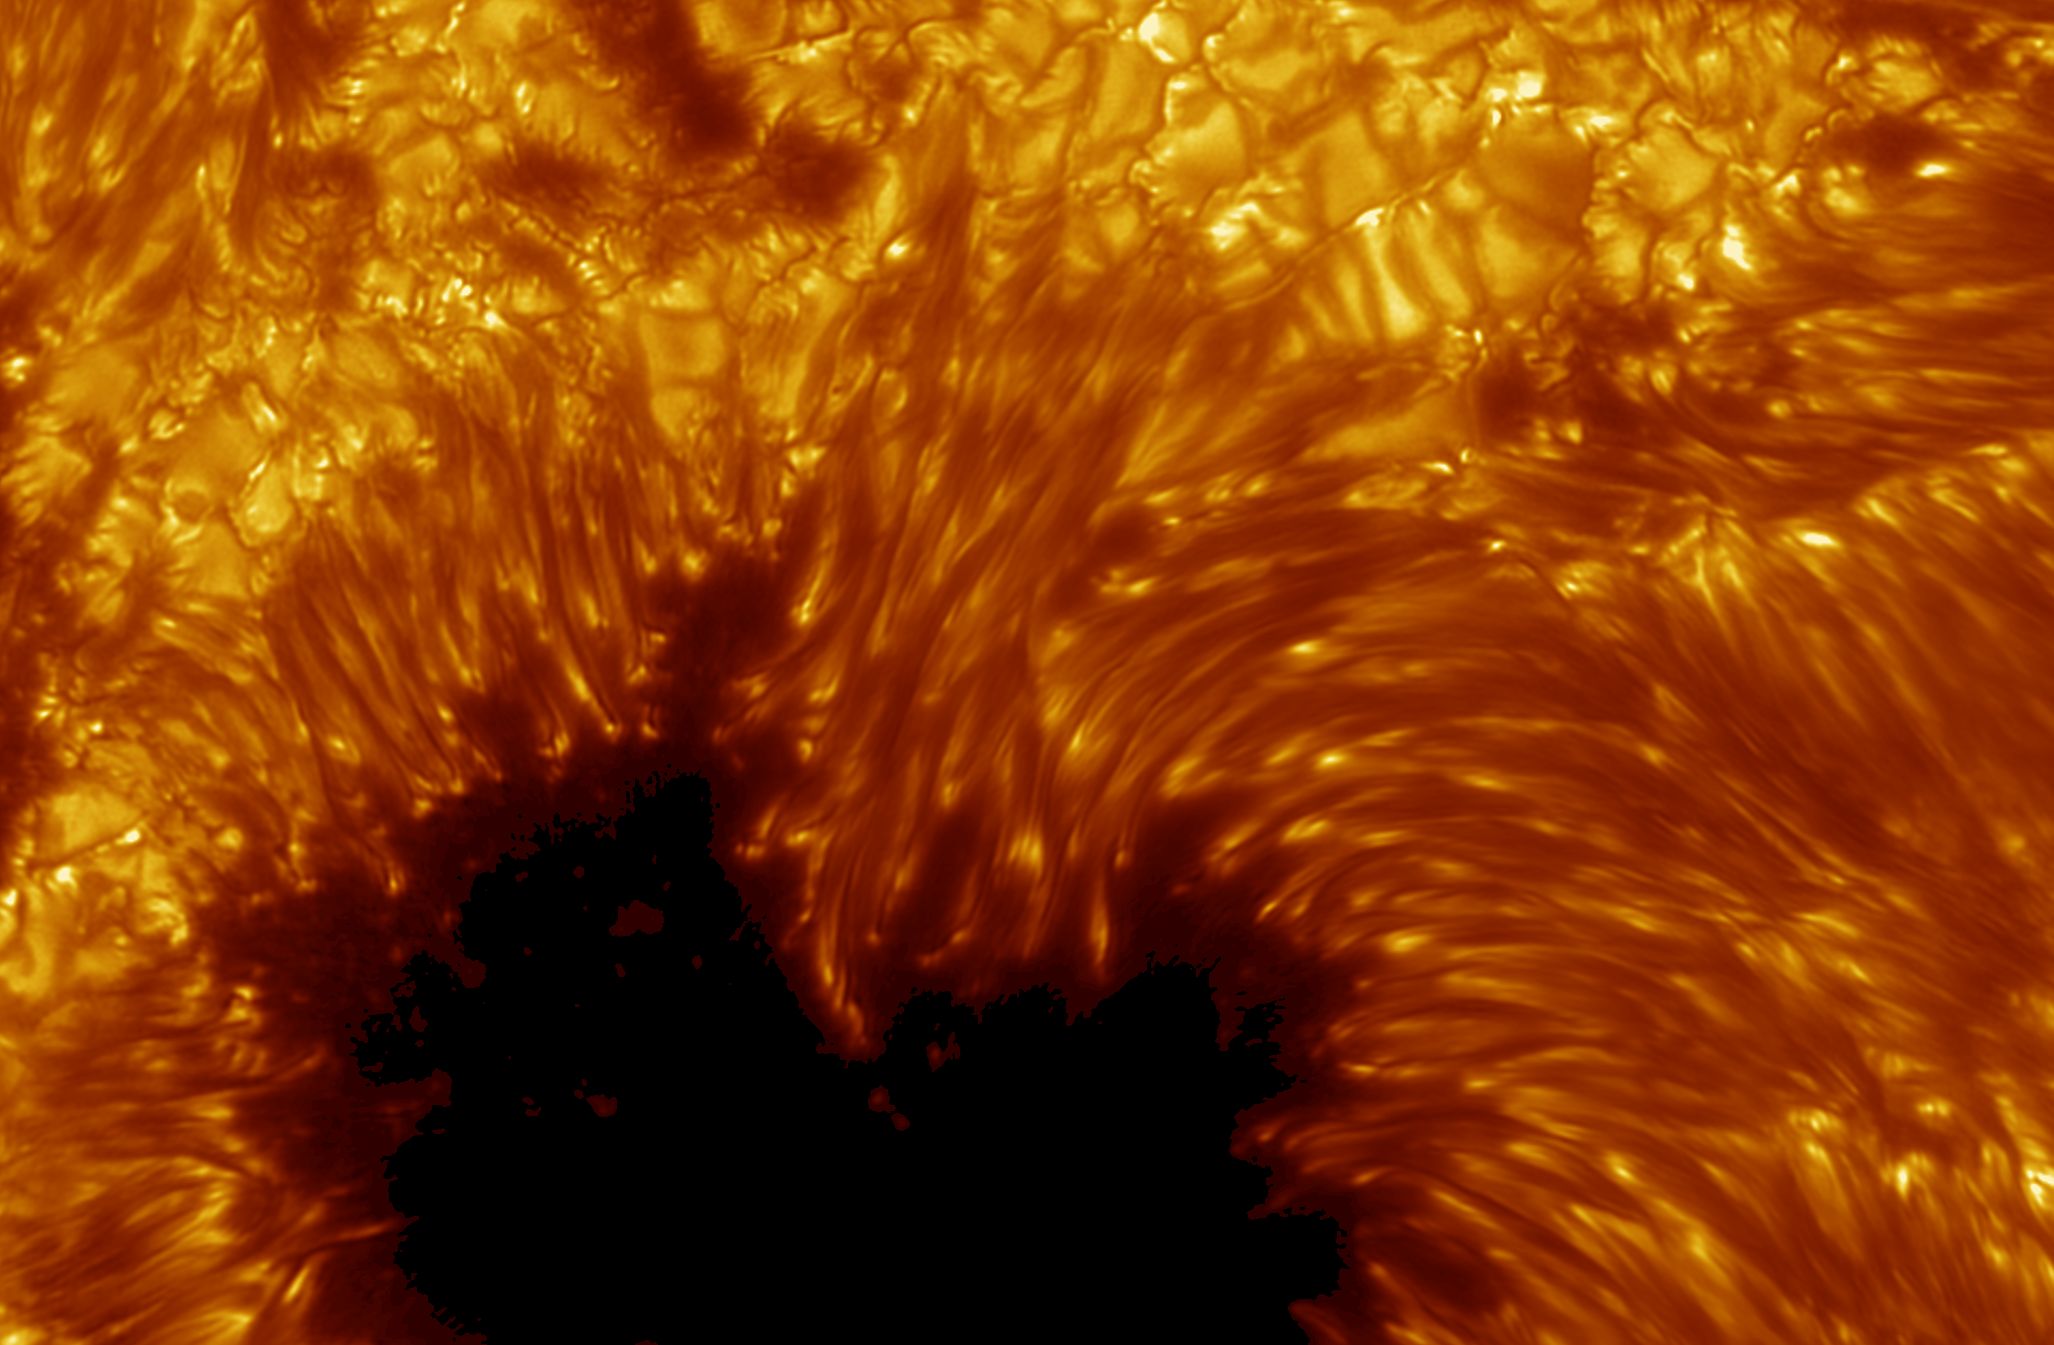
The sunspot itself can be divided into two parts:
- The central umbra, which is the darkest part, where the magnetic field is approximately vertical (normal to the Sun's surface).
- The surrounding penumbra, which is lighter, where the magnetic field is more inclined.
Magnetic pressure should tend to remove field concentrations, causing the sunspots to disperse, but sunspot lifetimes are measured in days or even weeks. Recent observations from the Solar and Heliospheric Observatory (SOHO) using sound waves traveling below the Sun's photosphere (local helioseismology) have been used to develop a three-dimensional image of the internal structure below sunspots; these observations show that there is a powerful downdraft underneath each sunspot, forming a rotating vortex that concentrates the magnetic field. Sunspots can thus be thought of as self-perpetuating storms, analogous in some ways to terrestrial hurricanes.
Sunspot activity cycles about every eleven years. The point of highest sunspot activity during this cycle is known as Solar Maximum, and the point of lowest activity is Solar Minimum. Early in the cycle, sunspots appear in the higher latitudes and then move towards the equator as the cycle approaches maximum: this is called Spörer's law.
Wolf number sunspot index displays various periods, the most prominent of which is at about 11 years in the mean. This period is also observed in most other expressions of solar activity and is deeply linked to a variation in the solar magnetic field that changes polarity with this period, too.
The modern understanding of sunspots starts with George Ellery Hale, who first linked magnetic fields and sunspots in 1908.[23] Hale suggested that the sunspot cycle period is 22 years, covering two polar reversals of the solar magnetic dipole field. Horace W. Babcock later proposed a qualitative model for the dynamics of the solar outer layers. The Babcock Model explains that magnetic fields cause the behavior described by Spörer's law, as well as other effects, which are twisted by the Sun's rotation.
Sunspot variation
Sunspot populations quickly rise and more slowly fall on an irregular cycle of 11 years, although significant variations in the number of sunspots attending the 11-year period are known over longer spans of time. For example, from 1900 to the 1960s the solar maxima trend of sunspot count has been upward; from the 1960s to the present, it has diminished somewhat.[24] Over the last decades the Sun has had a markedly high average level of sunspot activity; it was last similarly active over 8,000 years ago.[6]
The number of sunspots correlates with the intensity of solar radiation over the period since 1979, when satellite measurements of absolute radiative flux became available. Since sunspots are darker than the surrounding photosphere it might be expected that more sunspots would lead to less solar radiation and a decreased solar constant. However, the surrounding margins of sunspots are brighter than the average, and so are hotter; overall, more sunspots increase the Sun's solar constant or brightness. The variation caused by the sunspot cycle to solar output is relatively small, on the order of 0.1% of the solar constant (a peak-to-trough range of 1.3 W·m−2 compared to 1366 W·m−2 for the average solar constant).[25][26] Sunspots were rarely observed during the Maunder Minimum in the second part of the 17th century (approximately from 1645 to 1715).
Sunspot observation
Sunspots are observed with land-based and Earth-orbiting solar telescopes. These telescopes use filtration and projection techniques for direct observation, in addition to various types of filtered cameras. Specialized tools such as spectroscopes and spectrohelioscopes are used to examine sunspots and sunspot areas. Artificial eclipses allow viewing of the circumference of the Sun as sunspots rotate through the horizon.
Since looking directly at the Sun with the naked eye permanently damages vision, amateur observation of sunspots is generally conducted indirectly using projected images, or directly through protective filters. Small sections of very dark filter glass, such as a #14 welder's glass are effective. A telescope eyepiece can project the image, without filtration, onto a white screen where it can be viewed indirectly, and even traced, to follow sunspot evolution. Special purpose hydrogen-alpha narrow bandpass filters as well as aluminum coated glass attenuation filters (which have the appearance of mirrors due to their extremely high optical density) on the front of a telescope provide safe observation through the eyepiece.
Application
Due to its link to other kinds of solar activity, sunspot occurrence can be used to help predict space weather, the state of the ionosphere, and hence the conditions of short-wave radio propagation or satellite communications. Solar activity (and the sunspot cycle) are frequently discussed in the context of global warming; Jack Eddy noted the apparent correlation between the Maunder Minimum of sunspot occurrence and the Little Ice Age in European climate.[citation needed] Sunspots themselves, in terms of the magnitude of their radiant-energy deficit, have only a weak effect on the terrestrial climate[27] in a direct sense. On longer time scales, such as the solar cycle, other magnetic phenomena (faculae and the chromospheric network) do correlate with sunspot occurrence. It is these other features that make the solar constant increase slightly at sunspot maxima, when naively one might expect that sunspots would make it decrease [28]
British economist William Stanley Jevons suggested in the 1870s that there is a relationship between sunspots and business cycle crises. He reasoned that sunspots affect Earth's weather, which, in turn, influences crops and, therefore, the economy.[29]
Spots on other stars
In 1947, G. E. Kron proposed that starspots were the reason for periodic changes in brightness on red dwarfs.[2] Since the mid-1990s, starspot observations have been made using increasingly powerful techniques yielding more and more detail: photometry showed starspot growth and decay and showed cyclic behavior similar to the Sun's; spectroscopy examined the structure of starspot regions by analyzing variations in spectral line splitting due to the Zeeman Effect; Doppler imaging showed differential rotation of spots for several stars and distributions different from the Sun's; spectral line analysis measured the temperature range of spots and the stellar surfaces. For example, in 1999, Strassmeier reported the largest cool starspot ever seen rotating the giant K0 star XX Triangulum (HD 12545) with a temperature of 3,500 K (3,230 °C), together with a warm spot of 4,800 K (4,530 °C).[2][30]
Gallery
- Sunspots 1302 Sep 2011 by NASA.jpg
Sunspots September 2011.
- Sunspot 1112.jpg
A view of the coronal structure above a different sunspot seen in October 2010.
- Sunspot 923 at sunset and in solar telescope.jpg
Sunspot 923 at sunset and in solar scope
- Sunspot Mirage.JPG
Sunset Superior Mirage of sunspot #930
- Sun spot naked eye.jpg
Sunset in Bangladesh, January 2004
- The Sol.jpg
Setting sun with large sunspot, August 2010
See also
- Wolf number — a quantity that measures the number of sunspots
- Spörer's law — predicts the variation of sunspot latitudes during a solar cycle
- Joy's Law
- List of solar cycles
- Solar cycle
- Solar Rotation
- Space weather
- Radio propagation
References
- ↑ harvard.edu
- ↑ 2.0 2.1 2.2 press release 990610, K. G. Strassmeier, 1999-06-10, University of Vienna, "starspots vary on the same (short) time scales as Sunspots do", "HD 12545 had a warm spot (350 K above photospheric temperature; the white area in the picture)"
- ↑ Script error
- ↑ Script error
- ↑ Script error
- ↑ 6.0 6.1 Script error
- ↑ "Early Astronomy and the Beginnings of a Mathematical Science". NRICH (University of Cambridge). 2007. http://nrich.maths.org/6843. Retrieved 2010-07-14.
- ↑ Script error
- ↑ "Letter to the Editor: Sunspot observations by Theophrastus revisited"
- ↑ Script error See p. 93.
- ↑ Script error
- ↑ Script error
- ↑ doi:10.1086/141602
This citation will be automatically completed in the next few minutes. You can jump the queue or expand by hand - ↑ doi:10.1086/142452
This citation will be automatically completed in the next few minutes. You can jump the queue or expand by hand - ↑ Astrophysics of the sun, Harold Zirin, Cambridge University Press, 1988, p.307; http://adsabs.harvard.edu/abs/1988assu.book.....Z
- ↑ Phillips, Tony (3 September 2009). "Are Sunspots Disappearing?". NASA Science. http://science.nasa.gov/headlines/y2009/03sep_sunspots.htm.
- ↑ Script error
- ↑ Phillips, Tony (10 May 2006). "Long Range Solar Forecast: Solar Cycle 25 peaking around 2022 could be one of the weakest in centuries.". NASA Science. http://science.nasa.gov/science-news/science-at-nasa/2006/10may_longrange/.
- ↑ Dikpati, Mausumi (6 March 2006). "NCAR News Release: Scientists Issue Unprecedented Forecast of Next Sunspot Cycle.". University Corporation for Atmospheric Research. http://www.ucar.edu/news/releases/2006/sunspot.shtml.
- ↑ Wallis, Paul (22 April 2009). "Low solar outputs puzzling astronomers". Digital Journal. http://www.digitaljournal.com/article/271349.
- ↑ Hill, Frank et al. (14 June 2011). "What's down with the Sun? Major drop in solar activity predicted". http://www.boulder.swri.edu/~deforest/SPD-sunspot-release/SPD_solar_cycle_release.txt.
- ↑ NOAA/Space Weather Prediction Center: Solar cycle progression Retrieved March 17, 2012
- ↑ doi:10.1086/141602
This citation will be automatically completed in the next few minutes. You can jump the queue or expand by hand - ↑ Sunspot index graphics, Solar Influences Data Analysis Center (retrieved 27 September 2007).
- ↑ "Solar Forcing of Climate". Climate Change 2001: Working Group I: The Scientific Basis. http://www.grida.no/climate/ipcc_tar/wg1/244.htm. Retrieved 2005-03-10.
- ↑ Weart, Spencer (2006). "The Discovery of Global Warming". In Weart, Spencer. American Institute of Physics. http://www.aip.org/history/climate/index.html. Retrieved 2007-04-14.
- ↑ Hudson, H. (2008) Solar activity Scholarpedia. URL visited on 2011-1-27
- ↑ "Observations of solar irradiance variability". 1981. http://adsabs.harvard.edu/abs/1981Sci...211..700W.
- ↑ Script error
- ↑ derived images showing rotation of cool and warm starspots
External links
| 40x40px | Wikimedia Commons has media related to: Sunspots |
- Solar Cycle 24 and VHF Aurora Website (www.solarcycle24.com)
- Belgium World Data Center for the sunspot index
- High resolution sunspot image
- Sunspot images in high-res Impressive collection of sunspot images
- http://www.tvweather.com/awpage/history_of_the_atmosphere.htm
- NOAA Solar Cycle Progression: Current solar cycle.
- Current conditions: Space weather
- Lockheed Martin Solar and Astrophysics Lab
- Sun|trek website An educational resource for teachers and students about the Sun and its effect on the Earth
- Tools to display the current sunspot number in a browser
- The Sharpest View of the Sun
- Daily Sunspot Update and Picture of the Sun (www.spaceweather.com)
- Animated explanation of Sunspots in the Photosphere (University of Glamorgan)
Sunspot data
- "11,000 Year Sunspot Number Reconstruction". Global Change Master Directory. http://gcmd.nasa.gov/KeywordSearch/Metadata.do?Portal=GCMD&KeywordPath=%5BParameters%3ACategory%3D%27EARTH+SCIENCE%27%2CTopic%3D%27SUN-EARTH+INTERACTIONS%27%2CTerm%3D%27SOLAR+ACTIVITY%27%2CVariable%3D%27SUNSPOTS%27%5D&OrigMetadataNode=GCMD&EntryId=NOAA_NCDC_PALEO_2005-015&MetadataView=Brief&MetadataType=0&lbnode=gcmd3b. Retrieved 11 March 2005.
- "Unusual activity of the Sun during recent decades compared to the previous 11,000 years". WDC for Paleoclimatology. http://www.ncdc.noaa.gov/paleo/pubs/solanki2004/. Retrieved 11 March 2005.
- "Sunspot Numbers from Ancient Times to Present from NOAA/NGDC". Global Change Master Directory. http://gcmd.nasa.gov/KeywordSearch/Metadata.do?Portal=GCMD&KeywordPath=%5BParameters%3ACategory%3D%27EARTH+SCIENCE%27%2CTopic%3D%27SUN-EARTH+INTERACTIONS%27%2CTerm%3D%27SOLAR+ACTIVITY%27%2CVariable%3D%27SUNSPOTS%27%5D&OrigMetadataNode=GCMD&EntryId=FE00140&MetadataView=Brief&MetadataType=0&lbnode=gcmd3b. Retrieved 11 March 2005.
- "SUNSPOT NUMBERS". NOAA NGDC Solar Data Services. ftp://ftp.ngdc.noaa.gov/STP/SOLAR_DATA/SUNSPOT_NUMBERS/. Retrieved 21 June 2010.
- International Sunspot Number—sunspot maximum and minimum 1610–present; annual numbers 1700–present; monthly numbers 1749–present; daily values 1818–present; and sunspot numbers by north and south hemisphere. The McNish-Lincoln sunspot prediction is also included.
- American sunspot numbers 1945–present
- Ancient sunspot data 165 BC to 1684 AD
- Group Sunspot Numbers (Doug Hoyt re-evaluation) 1610-1995
- "SUNSPOT NUMBERS". NOAA NGDC Solar Data Services. ftp://ftp.ngdc.noaa.gov/STP/SOLAR_DATA/SUNSPOT_NUMBERS/. Retrieved 21 June 2010.
ar:كلفة شمسية be:Сонечныя плямы bg:Слънчево петно ca:Taca solar cs:Sluneční skvrna cy:Brycheuyn haul da:Solplet de:Sonnenfleck et:Päikeseplekk el:Ηλιακή κηλίδα es:Mancha solar eo:Sunmakulo fa:لکه خورشیدی fr:Tache solaire gl:Mancha solar ko:흑점 hr:Sunčeve pjege id:Bintik matahari it:Macchia solare he:כתם שמש ht:Tach solè la:Macula solaris lb:Sonnefleck lt:Saulės dėmė li:Zonnevlek jbo:solri barna hu:Napfolt ml:സൗരകളങ്കങ്ങൾ ms:Tompok matahari mn:Нарны толбо nl:Zonnevlek ja:太陽黒点 no:Solflekk pl:Plama słoneczna pt:Mancha solar ro:Pată solară ru:Солнечные пятна simple:Sunspot sk:Slnečná škvrna sl:Sončeva pega sr:Сунчеве пеге fi:Auringonpilkku sv:Solfläckar th:จุดมืดดวงอาทิตย์ uk:Сонячні плями vi:Vết đen Mặt Trời zh:太阳黑子

![]()